
TransparentPerceptron: Visualizing the Perceptron‘s decision iterations
Keywords: Machine Learning, Perceptron, Decision-making, Black Box, Visualization, Aesthetics.
Multi-layered Perceptrons (MLP), also widely known as Artificial Neural Networks, are one of the most used subsets of Machine Learning (ML) systems. They are inspired by the neural structure of the biological brain and consist of a series of layered and interconnected Perceptrons, also referred to as Artificial Neurons. These Perceptrons perform calculations on received data and send the results to a following layered group of Perceptrons (Baraniuk 2018), a procedure that is repeated until the output layer is reached (Mordvintsev et al. 2015). It is important to note that not all layers may perform the same calculations (Baraniuk 2018).
As MLPs grow deeper, the number of their layers increases, as can the number of Perceptrons per layer, which consequently rises the number of calculations or decision iterations (Mordvintsev et al. 2015). This increment in the number of iterations develops an iterative complexity of the decision-making process of these systems, turning them into black boxes (Strobelt et al. 2019).
Although the scientific community has been designing technical illustrations of the inner workings of ML systems, we find that these do not communicate compellingly with general audiences. Furthermore, they also do not reveal the decision-making process, failing an effective explanation for the non-scientific community (Doshi-Velez et al. 2017; Miller 2018; Hall et al. 2018).
Observing the inefficiency of the aforementioned illustrations, the decision-making opacity and omnipresence of these ML systems, led us to research and develop an algorithmic data-driven visualization, for the non-specialist observer, of the most elementary system of an MLP: the Perceptron.
This model initiates with two random weights, one that receives a random horizontal position and the other a bias value. During execution, this system runs a sequence of: 1) summing the weighted inputs 2) passing this sum to an activation function 3) calculating the guessing error; and finally, 4) adjusting each referred weight towards the goal achievement (Shiffman 2012).
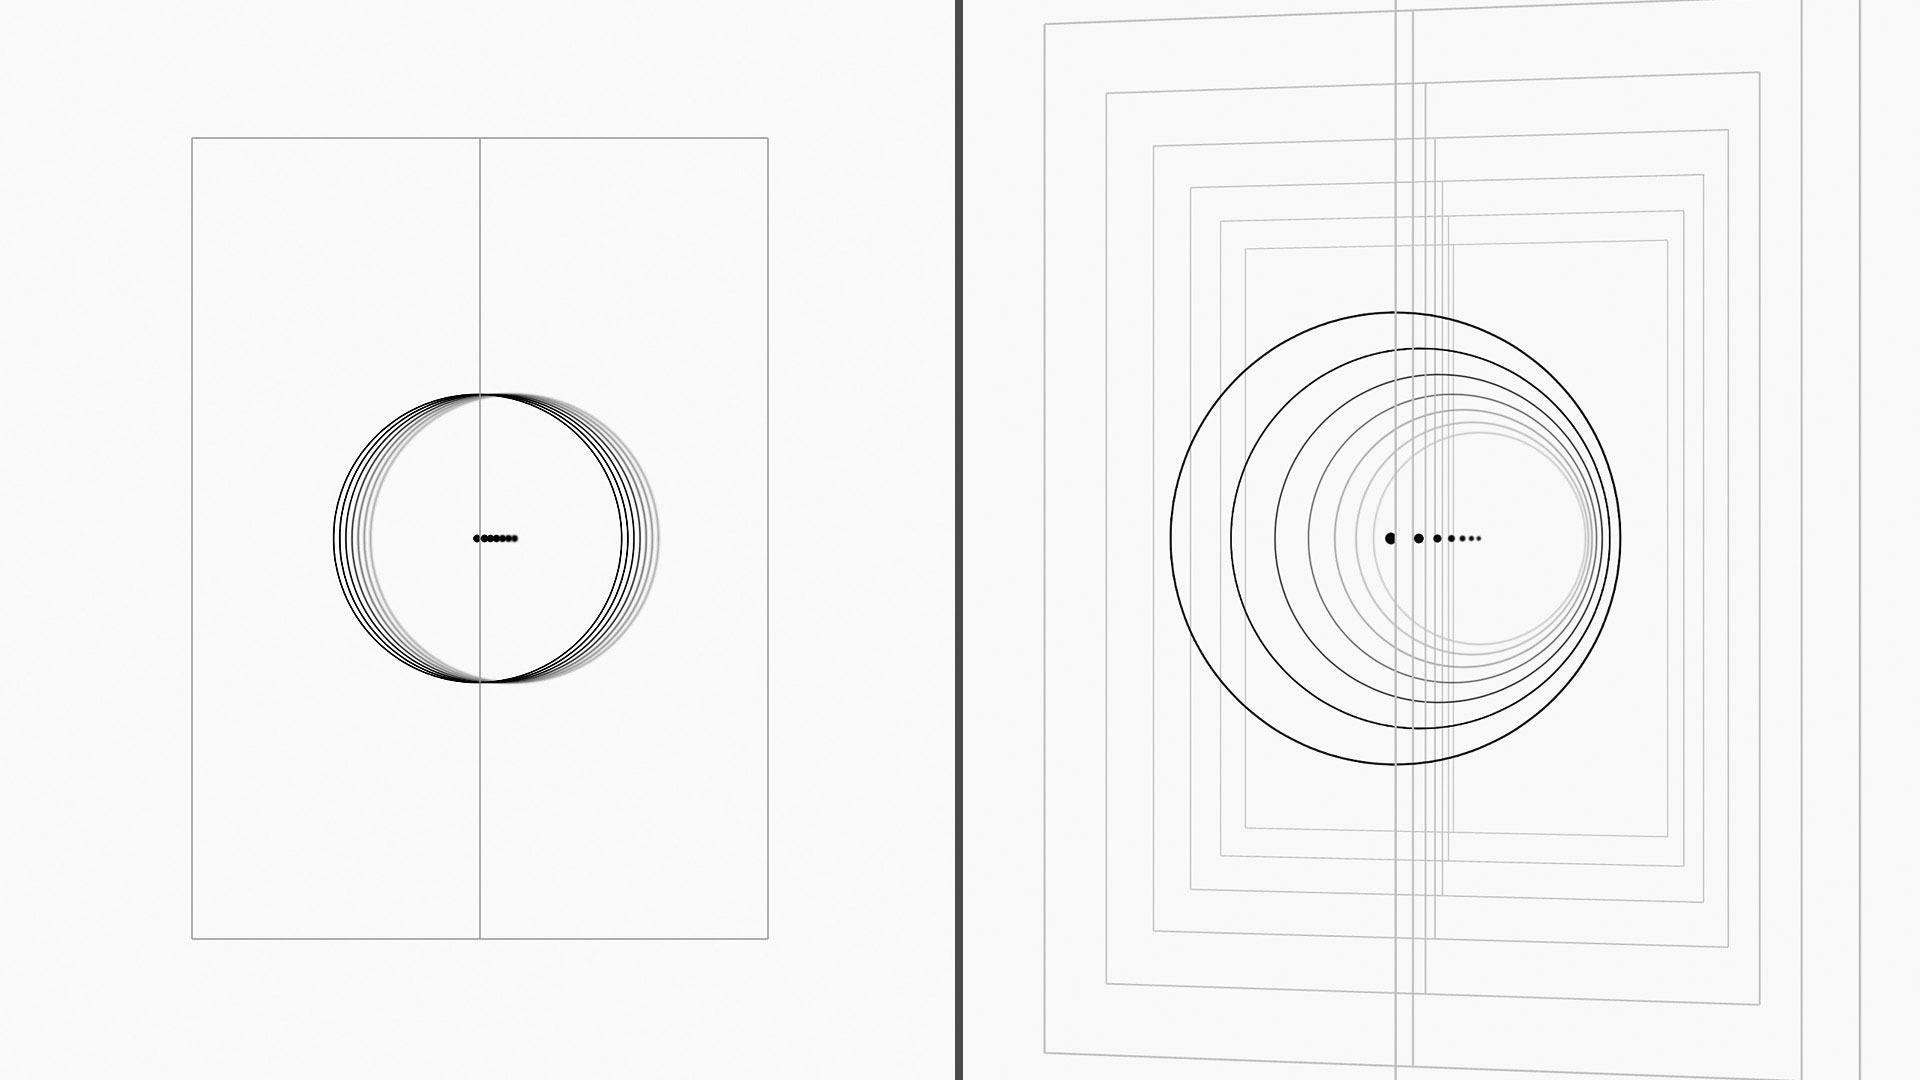
The execution sequence of our system develops an iteration array, storing the results of the calculations of each system step at each iteration. These stored values are used to feed a step-by-step composition consisting of an ellipse and a referenced center point, per iteration. Each step of this visualization reveals an updated position of the horizontal coordinate of the ellipse, a graphical representation of the calculations it has undergone at each iteration. Each graphical iteration is blurred with a value associated with the distance between the Perceptron's guess and the system's goal. All of this occurs in a vertically divided interface, where the left panel represents negative values and the right panel shows positive values.
After the Perceptron's decision iterations layering, a three-dimensional view is suggested. When clicked, a spatial gap is opened between each layer, allowing for a contemplation of each decision iteration.
Although we recognize that the decision-making process is not fully revealed, we believe that this artifact plays a significant role in allowing passive observation (Strobelt et al. 2019) and interpretation of the Perceptron’s accumulated iteration calculations.
Acknowledgements
This work is funded by FCT grant PD/BD/150328/2019 and FCT/MCTES NOVA LINCS PEst UID/CEC/04516/2019.
Available at
References
- Baraniuk, Chris. 2018. “For AI to Get Creative, It Must Learn the Rules—Then How to Break ‘Em.” Scientific American. Available at https://www.scientificamerican.com/article/for-ai-to-get-creative-it-must-learn-the-rules-mdash-then-how-to-break-lsquo-em/.
- Doshi-Velez, Finale and Been Kim. 2017. Towards a rigorous science of interpretable machine learning. arXiv. Available at https://arxiv.org/pdf/1702.08608.pdf.
- Hall, Patrick and Navdeep Gill. 2018. An Introduction to Machine Learning Interpretability. California, USA: Safari Books Online, LLC. Available at www.safaribooksonline.com/library/view/an-introduction-to/9781492033158/.
- Miller, Tim. 2018. Explanation in Artificial Intelligence: Insights from the Social Sciences. arXiv. Available at https://arxiv.org/pdf/1706.07269.pdf.
- Mordvintsev, Alexander, Christopher Olah, and Mike Tyka. 2015. Inceptionism: Going Deeper into Neural Networks. Google Research Blog. Available at https://research.googleblog.com/2015/06/inceptionism-going-deeper-into-neural.html.
- Shiffman, Daniel. 2012. The Nature of Code: Simulating Natural Systems with Processing. Available at https://natureofcode.com/book/.
- Strobelt, Hendrik and Sebastian Gehrmann. 2019. Interactive Visualization as Mediator Between Human and Machine Intelligence. Medium, Multiple Views: Visualization Research Explained. Available at https://medium.com/multiple-views-visualization-research-explained/interactive-visualization-as-mediator-between-human-and-machine-intelligence-1cf00d49c77e.
Join the conversation
xCoAx 2020: @marcoheleno, @mlcarvalhais and Nuno Correia “TransparentPerceptron”. An algorithmic data-driven visualization of a Perceptron to display its decision iterations to non-specialist observers. https://t.co/Qk1lOx3gyF #xCoAx2020 pic.twitter.com/dROnQ3pEKj
— xcoax.org (@xcoaxorg) July 8, 2020